
Better Logs, Better Insights
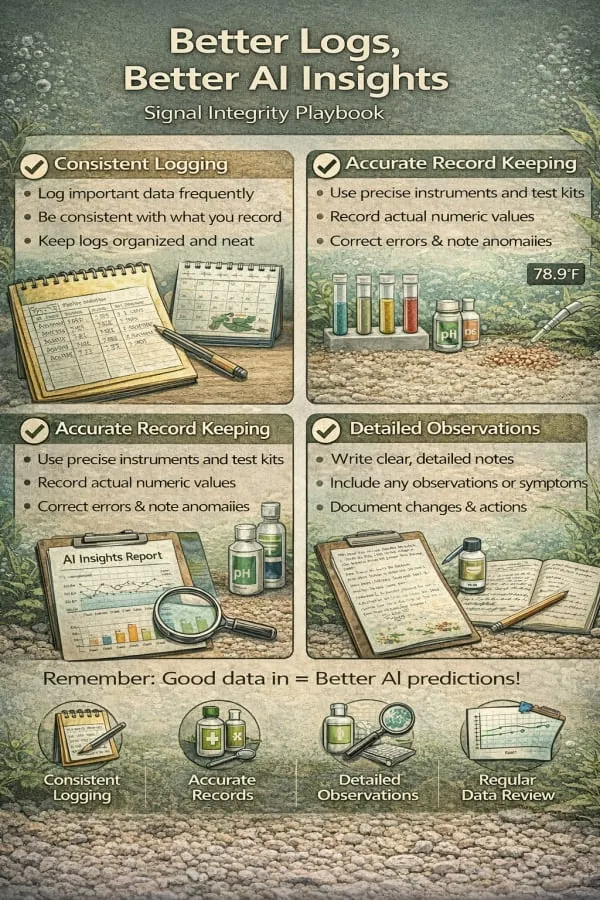
Aquarium logging done right: what to log, how to keep readings consistent, and how clean records make your trend charts and alerts genuinely trustworthy.
On this page
How to capture clean aquarium data so every chart, alert, and recommendation gets more accurate the longer you keep your tank.
Ask an aquarist with ten years in the hobby what separates their current tank from their first one, and the honest answer is rarely the equipment. It is information. They know what their tank looked like last month. They know what "normal" is for their system, so they notice "abnormal" a week before it becomes an emergency. They know that the last time they saw this particular algae, it followed a stretch of lazy water changes.
You can buy their equipment on day one. You cannot buy their history. You can only build it, one log entry at a time, and this guide is about building it well. Because here is the part most people miss: the quality of your records decides the quality of every conclusion drawn from them, whether the thing doing the concluding is you at 11 pm staring at a cloudy tank, a forum full of strangers, or an app analyzing your trends.
Your Tank's History Is Its Best Diagnostic Tool
A single test reading tells you surprisingly little. Nitrate at 30 ppm: is that a problem? It depends entirely on where it was last week. If it has sat at 30 for months in a heavily planted tank, it is probably fine. If it was 5 ppm ten days ago, something changed, and you want to know what before the fish tell you. The number is not the signal. The direction and speed of change is the signal, and you only get direction from history.
This is true across almost every problem the hobby throws at you:
- Disease: the question a good diagnosis starts with is "what changed in the two weeks before symptoms appeared?" Water quality dips, new livestock, temperature swings. Without logs, you are guessing. The fish health and quarantine guide leans on exactly this kind of timeline.
- Algae: algae outbreaks are almost always a lagging indicator of a nutrient or light imbalance that started weeks earlier. Logs let you find the start, not just the symptom. The algae control guide covers the diagnosis side.
- Cycling: whether a tank is cycled is a claim about a sequence of readings over time, never a single test. That is the entire premise of fishless cycling.
- Plant problems: a nutrient deficiency is diagnosed from the pattern of new versus old growth over weeks, matched against your dosing record.
- Emergencies: when something goes badly wrong, the first question in the emergency guide is what you know about the last 48 hours. Keepers with logs answer in seconds.
There is a second reason history matters that has nothing to do with troubleshooting: memory is a terrible logbook. Every keeper believes they did a water change "about a week ago." Measured against real records, that phrase routinely means anywhere from four days to three weeks. You are not sloppy; you are human. Writing it down is how you stop arguing with your own memory.
And if you use software to help run your tank, history is the raw material for everything intelligent it does. AquaLens's trend charts, early warnings, and AquaGuide answers are computed from your tank's own record, not from generic textbook ranges. Feed it noise and it sees noise. Feed it consistent, honest data and it sees your tank.
What Good Data Looks Like: The Four Cs
Good aquarium data has four properties. Miss any one of them and your trend lines quietly start lying to you.
- Complete. Key fields are filled in. "Dosed ferts" with no amount is a diary entry, not data.
- Consistent. Same units, same testing method, same rough time of day. A pH read at 7 am and a pH read at 9 pm in a planted tank are measuring two different chemical moments, and treating them as one series manufactures a swing that never happened. The water chemistry guide explains why pH moves through the day.
- Contextual. The entry records what changed and why. "Nitrate 40" is a number. "Nitrate 40, skipped last week's water change, feeding heavier since fry arrived" is a story you can act on.
- Comparable. This week's entry can be laid next to last week's. That mostly means resisting the urge to constantly change how you measure and describe things.
None of this requires effort so much as it requires deciding once and then not renegotiating with yourself every week.
The Minimum High-Quality Log Entry
For every meaningful event, capture four things:
- What changed
- When it changed
- How much changed
- What happened afterward
A strong entry: "Dosed NO₃ +10 ppm, 5.0 mL, 8:15 pm, lights on, CO₂ running. Next day: new growth tips noticeably greener."
A weak entry: "Added ferts."
The strong entry took perhaps fifteen extra seconds. Six weeks later, the weak entry is worthless and the strong one is evidence. The fourth item, what happened afterward, is the one almost everyone skips, and it is the one that turns a diary into an experiment log. You do not need it on every entry; you need it on every entry where you were trying to change something.
Pick Your Units Once and Never Change Them
Unit drift is the quietest way to destroy a dataset. A dosing history that reads "5 mL" one week and "half a cap" the next cannot be charted, compared, or trusted. Decide once, per tank:
- Volume: liters or gallons, not both. (The unit converter exists so you can translate at the boundary and log in one standard.)
- Dosing: mL for liquids, grams for dry salts. Never "caps," "squirts," or "pumps" unless you have measured exactly what one delivers and written that down.
- Chemistry: ppm for the nitrogen series and most nutrients. Reef keepers, keep dKH for alkalinity and be explicit, because dKH and meq/L histories do not mix.
- Temperature: °F or °C, one standard per tank.
The same discipline applies to naming. If you use dosing presets or repeated routines, name them by intent, amount, and cadence: "NO₃ +10 ppm (Mon/Wed/Fri)," "Fe +0.1 ppm (Tue/Thu)," "Post-Water-Change Macro Reset." Six months from now, a history full of names like that reads like documentation. A history full of "Dose 2 (new)" reads like archaeology.
Log at the Moment It Happens
Delayed logging creates two kinds of damage: the timestamp becomes fiction, and the details blur. The gold standard is logging at the moment of action, or within five minutes of it. That sounds demanding until you make the entry itself nearly free: presets, quick actions, and a phone already in your hand get most events logged in under ten seconds. AquaLens's repeating reminders help here in a specific way: when a dosing or maintenance reminder fires and you confirm it, the dose is logged automatically, so the act of remembering and the act of recording become the same tap.
When you genuinely cannot log in the moment, salvage what you can. Record the approximate time, mark the entry as logged late, and note what you are unsure about. An honest "roughly 9 pm, logged next morning" is usable. A confident timestamp that is silently wrong is worse than no entry, because it will mislead you later with a straight face.
The rule: fresh data beats perfect wording. A rough note captured now outranks a beautiful paragraph reconstructed on Sunday.
Test the Same Way Every Time
A trend line is only valid if the measurement method behind it is repeatable. Hobby test kits have real variance, and technique adds more. You cannot eliminate that noise, but you can hold it constant so that when the line moves, the tank moved.
- Test at roughly the same time of day. Morning versus evening matters for pH and, in planted tanks, for anything photosynthesis touches.
- Use clean vials, rinsed in tank water, not tap.
- Follow reagent timing and shaking instructions exactly. The famous API nitrate bottle 2 genuinely needs its full shake; lazy shaking reads low.
- Keep reagents from cross-contaminating, and replace expired kits. Expired reagents drift, usually toward reassuring numbers.
- Record the result immediately, before the vial hits the sink. "I'll remember it was 20" is how 20 becomes 10 by dinnertime.
Reading the result introduces its own error: color matching against a card is subjective, and lighting in the room shifts your judgment. This is one of the places AquaLens removes a whole error source, because you can photograph the strip or liquid vial and let the app read the color under calibration instead of eyeballing it, then review and log the reading in one step. Digital testers like Hanna checkers can be captured the same way, by camera, straight off the display.
For what the numbers actually mean once you have them, and how to tell real drift from kit noise, the water test interpretation guide goes parameter by parameter.
Photos Are Data, Not Decoration
A weekly photo, taken the same way, is one of the highest-value log entries you can make, because it captures a hundred things you did not think to write down. The keeper's eye adapts; the camera does not. Slow algae creep, gradual plant thinning, a fish that has been losing color for a month: all invisible day to day, all obvious across four consistent photos.
The standard that makes photos comparable:
- Same angle and same side of the tank each time
- Similar distance from the glass
- Similar time in the light cycle
- Glass cleaned before capture
Break those rules and week-to-week comparison mostly measures your camera position and your lighting, not your tank. Hold them and the photo series becomes a growth and health record. This pays off doubly if you keep live plants, where progress is exactly the kind of slow visual change photos catch; if you are still choosing what to grow, start with the plant selection guide.
Photos also feed identification. When something unfamiliar shows up, a fish looking off, an algae you cannot name, a hitchhiker on new plants, a photo ID with an honest confidence level beats an anxious forum thread, and the ID lands in your logbook with a timestamp, linked to care information from the species library.
Tag Causes So You Can Find Effects
An unstructured journal is hard to interrogate. When you log an action, tag what kind of event it is: maintenance, dosing, livestock change, equipment change, or plain observation. Then, for interventions, add one line of expected outcome: "Expected: pearling improves within 2 to 3 days," "Expected: nitrate slope flattens by next test."
Two things happen when you do this. First, your journal becomes searchable by cause: every equipment change in the last year, every livestock addition before an outbreak. Second, the expected-outcome line forces you to make a prediction, and comparing predictions to results is how you actually learn what works in your tank rather than what forums say should work.
The discipline that makes cause-and-effect readable is changing one major variable per observation window, typically 5 to 7 days. Change the photoperiod, the dosing, and the flow in the same weekend and the tank will respond, but you will never know to what. Advanced keepers are not more patient by temperament; they have just been burned enough times to stagger their changes.
The Five Ways Logging Goes Wrong
Batch logging days later
Problem: timestamps become unreliable and details blur into fiction.
Fix: log a minimal entry immediately, using presets or quick actions, and add detail later if it matters.
Multiple major changes at once
Problem: when the tank responds, the root cause is unrecoverable.
Fix: one major variable per 5 to 7 day window. Emergencies excepted; safety beats science.
Unit drift
Problem: mL one week and "caps" the next cannot be compared or charted.
Fix: one unit standard per tank, written down, never renegotiated.
Missing the "before" baseline
Problem: without a pre-change reading or photo, you cannot evaluate whether the intervention did anything.
Fix: capture a test or photo before every deliberate change. The water change calculator and dosing calculator tell you what a change should do to the numbers; the baseline tells you what it actually did.
Stale tank profiles
Problem: if your recorded stocking and equipment no longer match reality, every analysis built on them starts from a false premise. Advice tuned for last year's stocking can be wrong for this year's.
Fix: update livestock and equipment records immediately when they change, in the same sitting as the change itself.
How Much to Trust an Entry
Not all entries deserve equal weight when you review them later. A simple grading habit keeps you honest:
- A, high confidence: complete, logged in the moment, standard units, context included
- B, usable: mostly complete, minor gaps
- C, low confidence: delayed and vague
- D, do not interpret: missing quantity or time, or the method itself was uncertain
If a stretch of history is mostly C and D, treat any trend conclusion drawn from it as tentative, and fix the habit before trusting the chart again. This grading is a rule of thumb, not a lab standard, but it maps well onto how much a record can honestly support a decision.
The Two-Minute Weekly Routine
If all of the above sounds like work, here is the honest minimum that captures most of the value:
- Use presets or reminders for routine maintenance and dosing, so those log themselves.
- Add one short note per meaningful change: what changed, plus expected effect.
- Take one standard weekly photo.
- Run your weekly test panel and log it immediately.
- Glance at your trends once a week, on a schedule, not just when something looks wrong.
That routine costs about two minutes beyond the maintenance you were doing anyway, and it is enough to make every chart and recommendation about your tank meaningfully smarter. If your tank is under three months old, fold this into the rhythm in the first 90 days guide, which is exactly the period when a clean baseline matters most.
Operator Mode: For Keepers Who Want More
Once the basics are automatic, the ceiling gets higher:
- Define fixed weekly sampling windows, the same day and hour, so every series is aligned.
- Isolate interventions into controlled windows and never overlap them.
- Tie each intervention to a measurable outcome: nitrate slope between water changes, new growth quality, algae spread, fish respiration and behavior stability.
- Review month-over-month direction, not isolated readings. A reading is weather; a slope is climate.
- Audit your own dataset quarterly: unit drift, orphaned presets, stale profiles.
This is the point where a logbook stops being a safety net and becomes an instrument. Keepers who run this way can answer questions like "how fast does my tank consume nitrate per week in summer versus winter," which sounds academic until it is exactly the number that explains an algae bloom.
For Saltwater Keepers
Everything above applies to reef tanks, with the volume turned up. Reef chemistry is a consumption game: corals draw down alkalinity, calcium, and magnesium continuously, and the entire craft of stable reefkeeping is measuring that consumption rate and matching it with dosing. That makes logging not a good habit but the core skill. An alkalinity number means little; an alkalinity slope is everything, which is why serious reefers test alk daily or near-daily during instability. Reef parameters covers targets and tolerances, and the reef dosing calculator turns a measured consumption rate into a two-part dosing plan. AquaLens tracks the full reef suite, alkalinity, calcium, magnesium, salinity and the rest, in the same per-tank logbook as everything else, and Pro users can import ICP results so lab-grade snapshots land in the same history.
Log From Any Browser
The biggest practical obstacle to consistent logging is that the moment of information and the moment of logging are often in different places. You test at the tank, but you think about the tank from your desk. This is why AquaLens has a full web companion at aqualensapp.com/app: your My Tanks dashboard, logbook, trends, and AquaGuide chat in any browser, on any machine. Log a reading from your laptop and it syncs to your phone; scan a test strip on your phone and the chart on your desktop already knows. One account, same data everywhere. Core logging in the app works without an account at all; signing in is what turns your logbook into a synced, cloud-backed record you cannot lose to a dropped phone. There is also a community hub on the web when you want other keepers' eyes on your data.
Doing This With AquaLens
The habits this guide asks for are the ones AquaLens automates, so a clean logbook stops depending on your discipline every single day.
- Every event auto-logs in your standard units. Confirm a dosing or maintenance reminder and the dose records itself; scan a test kit and the reading files into the same per-tank journal, timestamped, without the unit drift and delayed-entry problems this guide warns about.
- Your trend charts are only as honest as that record. Chemistry lines for the full freshwater and reef suite run from a week to a year, so the Four Cs stop being an ideal and become the visible difference between a chart you can trust and one you cannot.
Get AquaLens free and let the routine log itself.
The Weekly Signal Check
Eight questions, once a week:
- Livestock list current?
- Equipment settings current?
- Units still standardized?
- Presets used instead of free-text guessing?
- At least one full parameter panel logged?
- One standardized photo captured?
- Major changes isolated and documented?
- Last week's expected outcomes compared against what actually happened?
Eight yeses means your dataset is strong and every conclusion built on it, yours or the app's, stands on solid ground.
The Final Rule
You do not need perfect data. You need consistent, honest, structured data, captured close to the moment it happened. Small, clean logs beat long, messy logs, and a keeper with six months of honest records will out-diagnose a keeper with six years of vibes. Start this week; the history you will want next year begins with the entry you make today.
Frequently Asked Questions
What should I log in my aquarium journal?
For every meaningful event, capture four things: what changed, when it changed, how much changed, and what happened afterward. That covers water tests, water changes, dosing, feeding changes, new livestock, equipment changes, and anything unusual you observe. A short entry made in the moment beats a detailed one reconstructed days later.
How often should I test my aquarium water?
A weekly full panel at a consistent time of day is the useful baseline for an established freshwater tank. Test more often during cycling, after adding livestock, or whenever something looks wrong. Reef keepers should test alkalinity much more frequently, daily or near-daily during periods of instability, because coral consumption changes fast.
Why do my aquarium test results jump around so much?
Most apparent swings come from inconsistent method rather than the tank: testing at different times of day, lazy reagent shaking, dirty vials, expired kits, or subjective color matching under different room lighting. Hold your method constant and the noise drops sharply. Real trends move over days and weeks, not test to test.
Can I log my aquarium data from a computer?
Yes. AquaLens has a web companion at aqualensapp.com/app with your My Tanks dashboard, logbook, trend charts, and AquaGuide chat in any browser. Entries made on the web sync with the mobile app, so one account keeps the same data everywhere.
Do I really need to write down water changes and doses?
Yes, because memory is unreliable at exactly this kind of task. Most keepers who say they changed water about a week ago are off by days in either direction. Recorded maintenance history is also the first thing you need when diagnosing disease, algae, or a parameter swing, since the cause usually sits in the previous two weeks of changes.
Should I change more than one thing in my aquarium at a time?
Outside of emergencies, no. Change one major variable per observation window of roughly five to seven days, then watch the response before changing the next thing. If you adjust lighting, dosing, and flow in the same weekend, the tank will respond but you will never know which change caused what.
How do I keep aquarium photos comparable over time?
Shoot from the same angle and side of the tank, at a similar distance, at a similar point in the light cycle, with the glass cleaned first. Consistent conditions mean week-to-week differences reflect the tank rather than the camera. A weekly standard photo catches slow changes like algae creep and plant thinning that the eye adapts to and misses.
How does AquaLens use my logging history?
Every scan, dose, water change, and note lands in a per-tank logbook, and the app builds chemistry trend charts from it covering a week up to a full year. Predictive alerts, a Pro feature, watch those trends and warn when a parameter is drifting toward trouble before it crosses a line. AquaGuide chat with Pro answers questions using your full tank context, so the quality of its advice tracks the quality of your logs.
Let Your Logbook Build Itself
Every scan, dose, and water change auto-logs into per-tank trend charts, and the longer your history grows, the earlier AquaLens can warn you before a problem becomes an emergency.
Keep reading
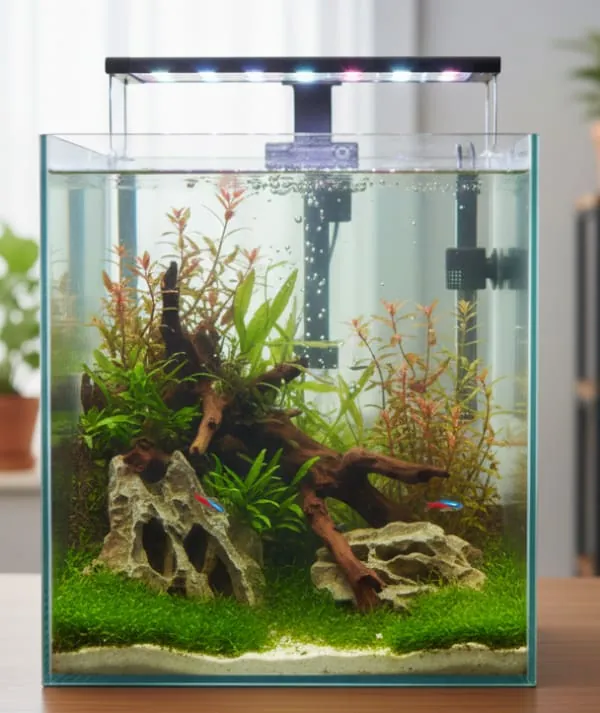
The complete AquaLens feature reference: every tab, lab, and tool for freshwater and reef tanks, from test scanning to predictive alerts and the web app.
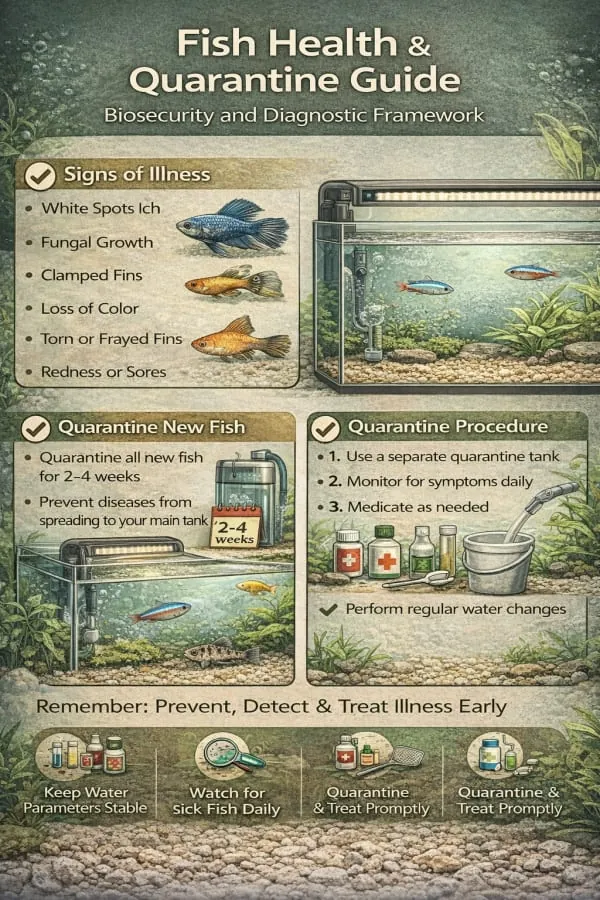
Quarantine new fish, spot the early warning signs, and treat disease without wrecking your tank. A practical freshwater fish health guide.
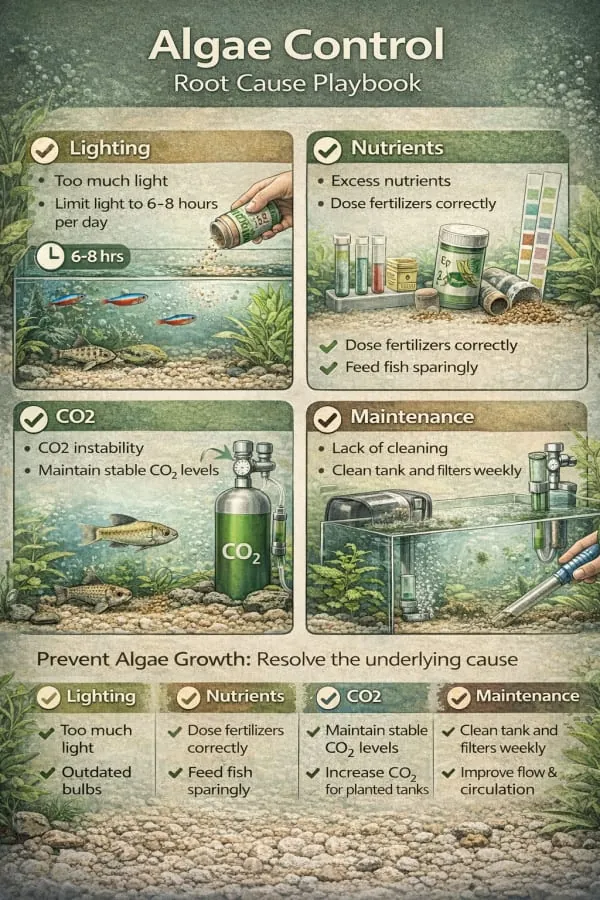
Identify every common aquarium algae and bacterial bloom on sight, understand the biology behind it, and fix the cause instead of scrubbing.